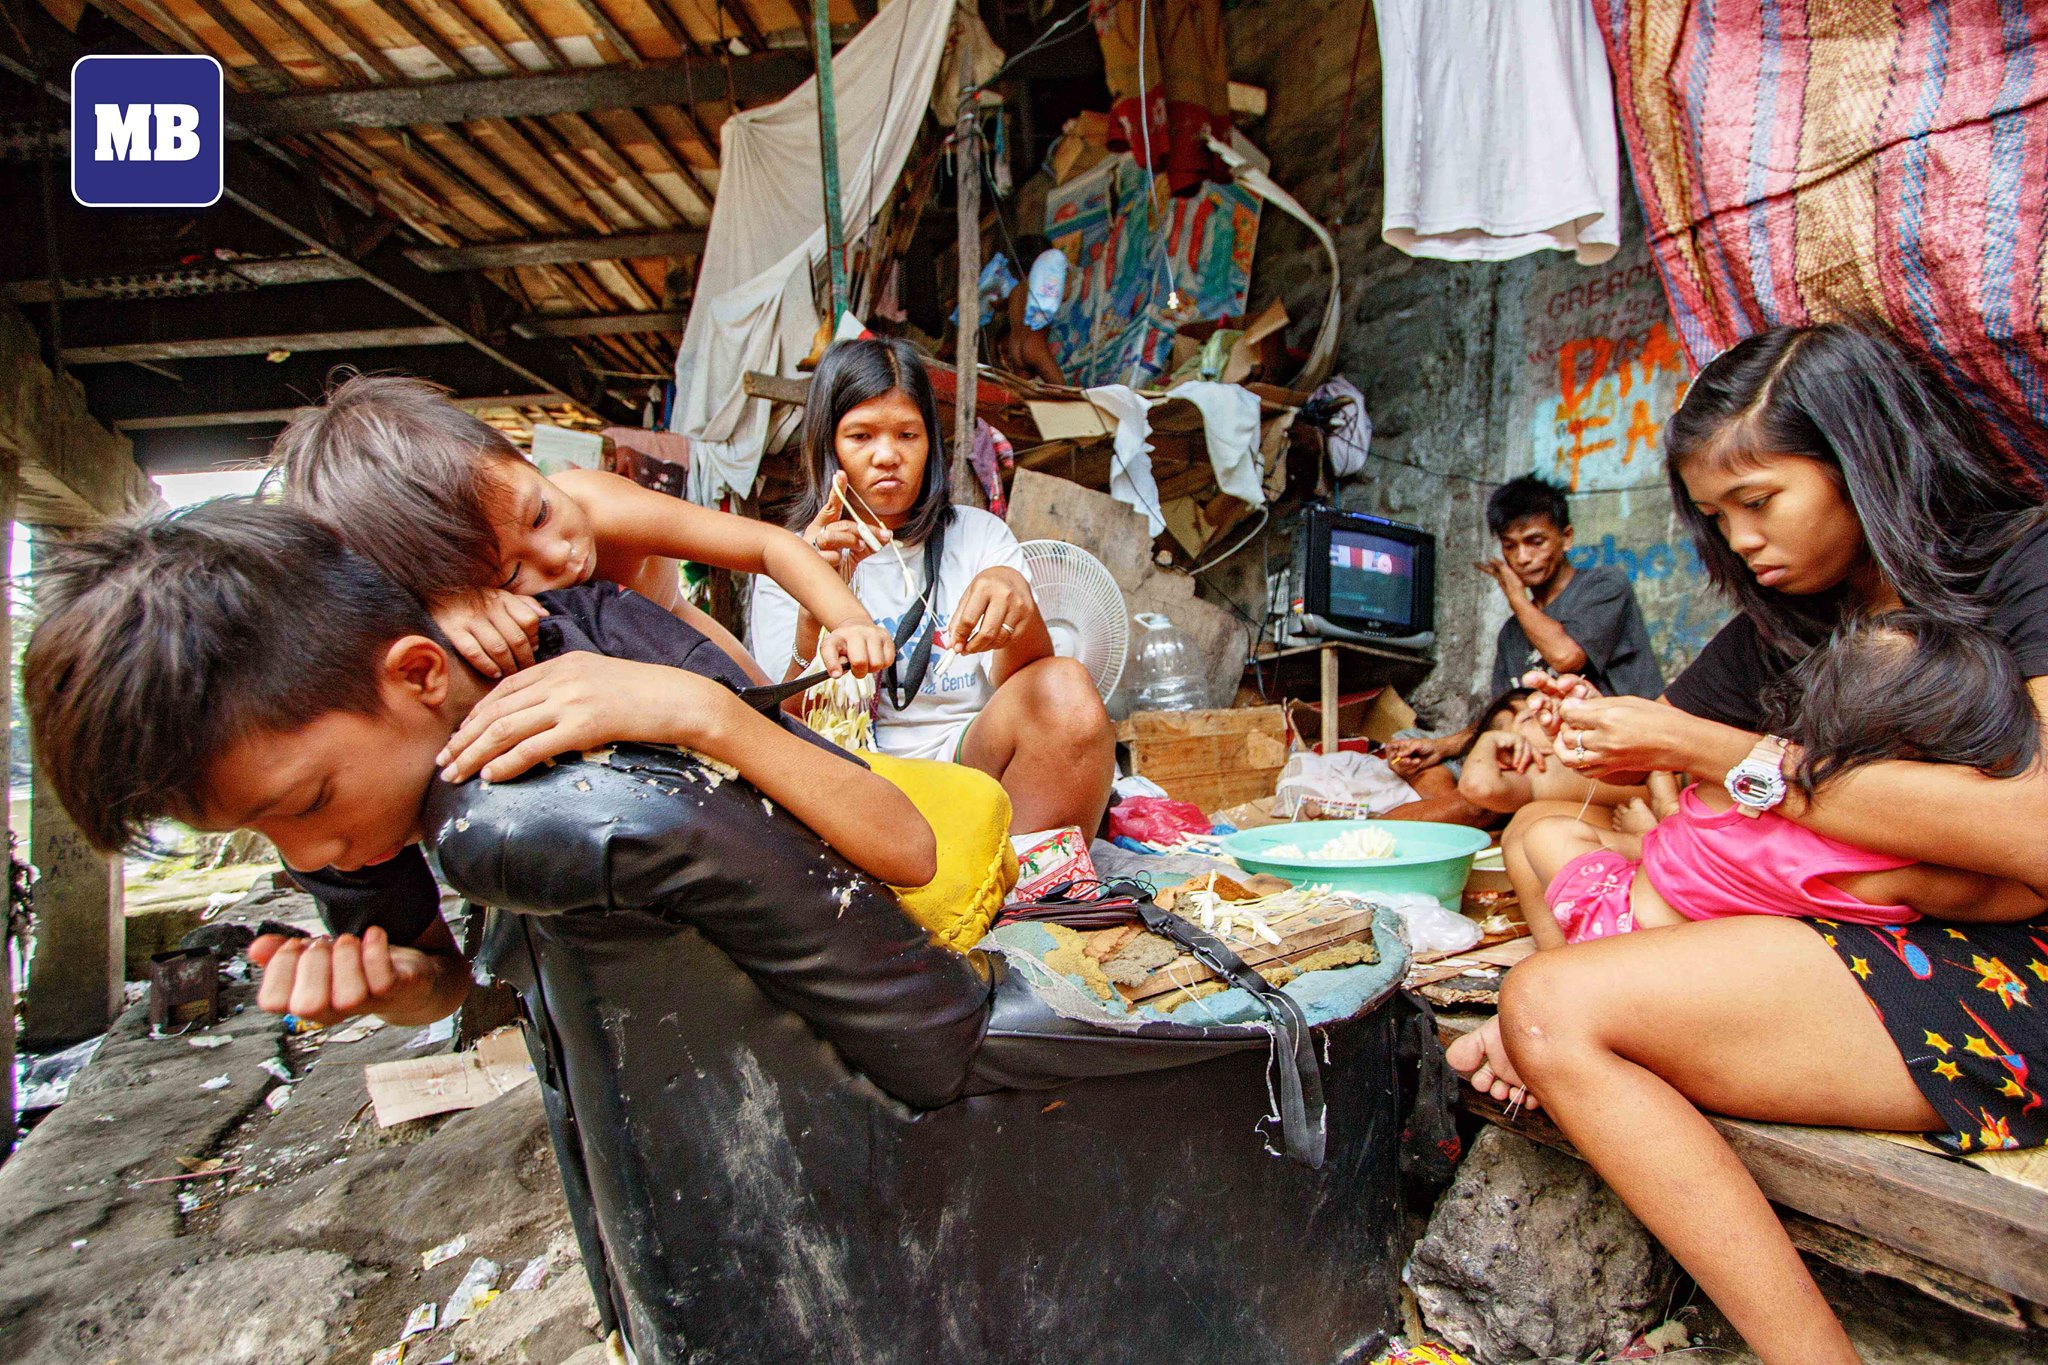
22.4%
of the Philippines' population are living under the poverty line.
That's over
25 million Filipinos
who struggle daily
According to PSA, over 9.79 million of Filipinos are unable to meet their basic food needs [1]
NEDA estimates that around 7.2 million are unable to escape poverty due to inflation rates [2]
Problem
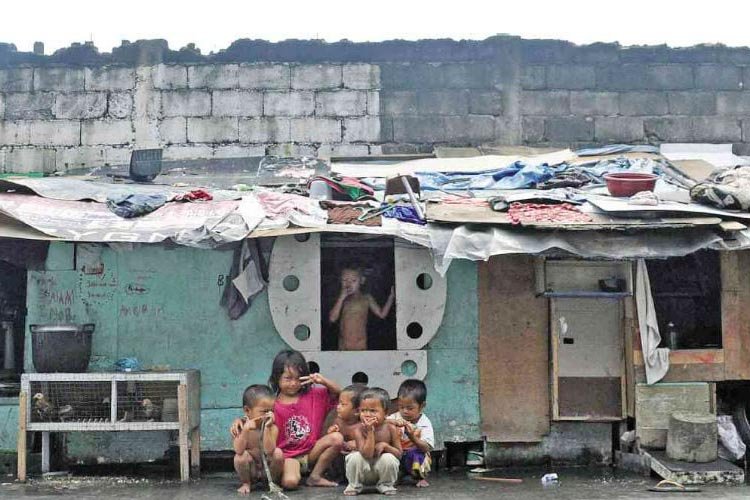
The continuous struggle of Filipino households in sustaining their daily lives due to the prevalence of poverty in the Philippines
01 Overview
Poverty
continues to
affect our country

Solution
Utilizing data science to identify the factors that negatively affect the finances of Filipino households in hopes of inspiring government or community-driven actions
We want to do what we can to reduce the number of families living in unsustainable conditions

Null Hypothesis
There is no significant correlation between household factors and financial well-being among families
Alternative Hypothesis
There is a significant negative correlation between household factors and financial well-being among families
Action Plan
Analyze the different factors involved in households' expenditure in the dataset
88
features / columns
165,029
entries / rows
Handling Missing/Null Values
The dataset was checked for null/missing values. The dataset contains a total of 165,029 entries and 88 features and it was confirmed that the dataset does not contain missing or null values as its dimensions remained the same after processing.
Addition of Features
We added certain features which we would use in our statistical analysis, such as a binary column to indicate whether a household receives wages and another if they own or operate a business. We also added a column that computes the net total of a family every month, and each family's financial category.
Dropping Certain Features
However, we also dropped certain features that are redundant and not related to the study such as some of the elements in the breakdowns of the total income and a few nominal features.
Sampling the Data
Due to the huge volume of data, processing it would be time and resource heavy. So, we sampled 10% of the original volume which can be seen in the data section, leaving us with a sampled dataset containing 16,503 entries. We ensured that our sampled data is balanced as per the financial category feature, which means that in our sample there are 5501 entries of households per financial category.
In a nutshell...
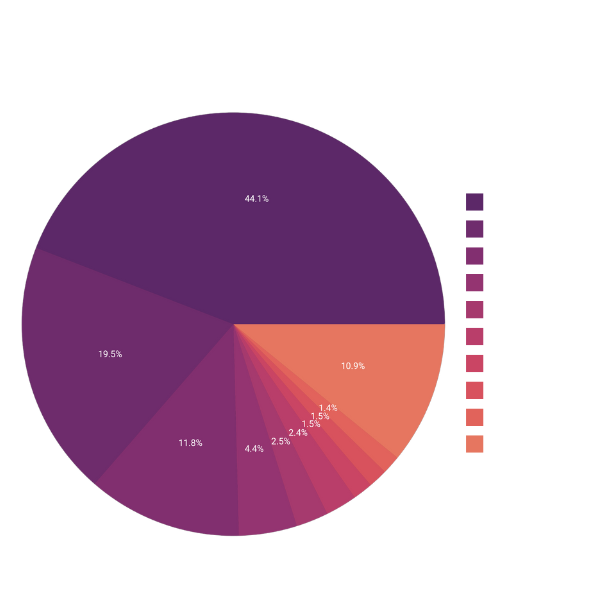
This graph illustrates the average allocation of household income across key expenditure categories based on annual data from Filipino households incomes and expenditures. Notably, a significant portion of household income is allocated to food and water expenditures. This study aims to identify the expenditures that heavily affect a household's financial status and determine the effect of having businesses or employment wages to a households' overall financial status.
Feature Selection
To answer our primary question of identifying which factors most negatively affect Filipino households' finances the most, we utilized the Random Forest Classifier algorithm in a feature importance analysis. The graph below shows the importance value of the top ten identified features.
This data reveals that non-food expenditure, water supply, and bread, among others, seem to impact family finances the most. We can thus reject the null hypothesis and accept the alternative hypothesis as we have identified correlation between various factors and financial well-being among Filipino families.
Effect of Wages on Finances
In our analysis, we wanted to seek the answer to the question "Do households with regular wages coming from employment exhibit different patterns of negative income compared to those relying primarily other sources of income?"
Null Hypothesis
There is no significant difference between households that have wages from employment and those that don't
Alternative Hypothesis
There is a significant difference between households that have wages from employment and those that don't
To do so, we utilized a chi-squared test to see if there is a significant difference between households with and without wages. Here's what we got:
Chi-squared statistic
270.93991
P-value
1.46604e-59
The p-value is less than 0.05. Hence, we reject the null hypothesis and accept the alternative hypothesis. This implies that there is a significant difference between households that have regular wages from employment and those who do not.
The number of households that have wages (employment income) in the high category is significantly greater than the number of households without wages. This implies that having employment income or wages in a household can help in improving their financial status. However, the financial category of a household can still be affected by multiple factors (mainly their expenditures) which explains why there are still households(with employment income) that are in the moderate and low financial category.
Effect of Business Ownership on Finances
We also wanted to answer the question "Do households with higher levels of entrepreneurial activities exhibit different patterns of negative income compared to those relying primarily on wage employment or other sources of income?"
Null Hypothesis
There is no significant difference between households that have a business and those that don't
Alternative Hypothesis
There is a significant difference between households that have a business and those that don't
To do so, we utilized a chi-squared test to see if there is a significant difference between households with and without a business or entrepreneurship. Here's what we got:
Chi-squared statistic
23.64858
P-value
7.32447e-06
The p-value is less than 0.05. Hence, we reject the null hypothesis and accept the alternative hypothesis. This implies that there is a significant difference between households that have a business or entrepreneurial income and households that do not.
The number of households that have businesses or entrepreneurial activities in high category is greater than the number of households without businesses. This implies that having a business or doing entrepreneurial activities can help in improving their financial status. However, the financial category of a household can still be affected by multiple factors (mainly their expenditures and in this case their business losses) which explains why there are still households (with entrepreneurial activities) that are in the moderate and low financial category. Moreover, households' (that don't have entrepreneurial activities) financial category can also be improved by the presence of other sources of income which explains the number of households in the high category for those without entrepreneurial activities.
Testing out Different Predictor Models
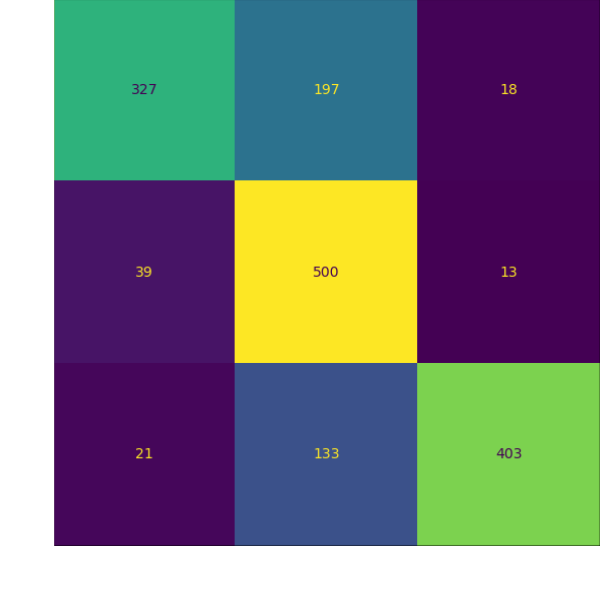
The performance of Support Vector Machine (SVM), Recursive Feature Elimination (RFE), and Logistic Regression models in predicting the financial status of a household given their income and expenses were compared to identify the best model. To interpret the following figures, take note that we denoted high, moderate, and low financial statuses by the numbers 1, 0, and -1, respectively. Those that are of low financial status are most prone to the risk of experiencing the effects of poverty. Here's what we found:
Support Vector Machine Performance
A confusion matrix of the prediction performance of the SVM model is presented below, alongside its cross-validation and test accuracies.
Cross-Validation Accuracy
0.71559
Test Accuracy
0.74500
Recursive Feature Elimination Performance
A confusion matrix of the prediction performance of the RFE model is presented below, alongside its cross-validation and test accuracies.
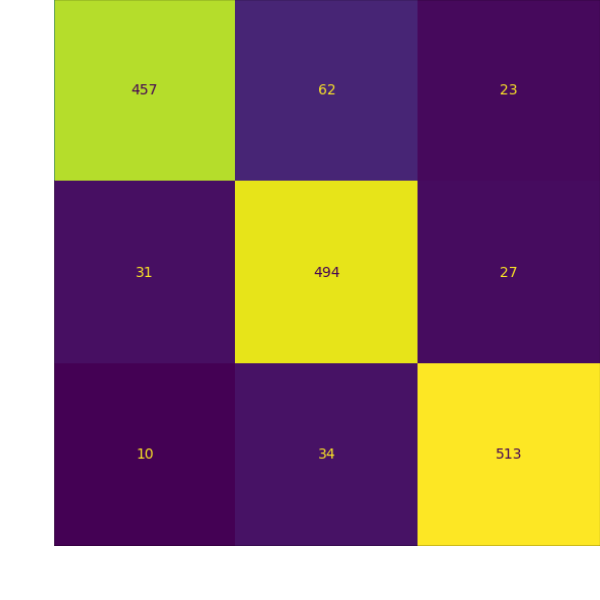
Cross-Validation Accuracy
0.86157
Test Accuracy
0.88674
Logistic Regression Performance
A confusion matrix of the prediction performance of the Logistic Regression model is presented below, alongside its cross-validation and test accuracies.
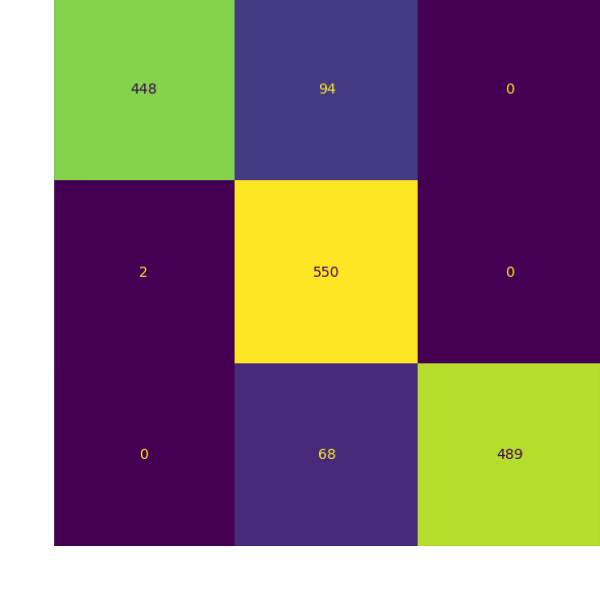
Cross-Validation Accuracy
0.88796
Test Accuracy
0.90067
Evidently, we can identify that logistic regression tends to yield the best results, as it scored the highest in both cross-validation and test accuracies. This performance could still be improved, however, using Grid Search to identify the best possible parameters for the highest possible accuracy of the model. The following section reveals the result of the improved model.
Improved Logistic Regression Model
A confusion matrix of the prediction performance of the Logistic Regression model with improved parameters as identified through Grid Search is presented below, alongside its cross-validation and test accuracies. This is clearly a substantial improvement over any of the earlier models presented.
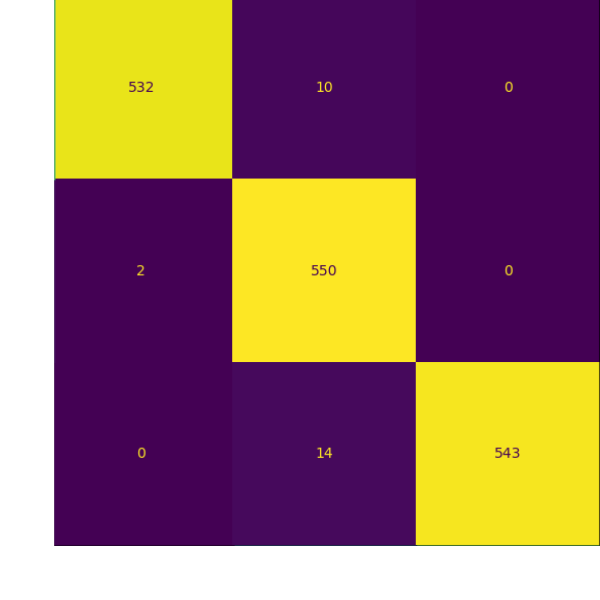
Additionally, here's a t-SNE (t-distributed Stochastic Neighbor Embedding) visualization of the decision boundaries of our improved logistic regression model.
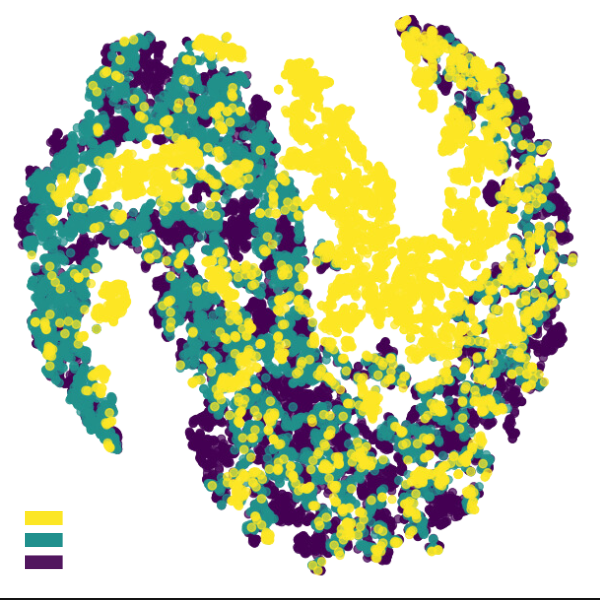
Cross-Validation Accuracy
0.97825
Test Accuracy
0.98425
Using this model accurately predicts under what financial category you would most likely fall under: high (1), moderate (0), and low (-1). Those that are predicted to be classified under low financial category are at highest risk of experiencing poverty.
Summary & Relevance
This study identified that food, utilities, and transportation are among the most influential factors in a household's financial situation in the Philippines. Additionally, it was shown that having entrepreneurial activities and an employed household member significantly impacts their financial stability.
Understanding these major financial expenditures can help policymakers develop the appropriate subsidies and assistance programs which can help improve a household's overall financial health. Moreover, the recognition of the importance of employment and entrepreneurship can drive policies that promote the creation of job opportunities and support small businesses. This can also promote the creation of programs focused on skills training, job matching, and entrepreneurial seminars that can have huge positive effects in the long run.
Overall, the results of this study can help in the appropriate and effective allocation of resources. This study identifies the expenditures that most affect an average household, which
Call to Action
Prioritize Affordable Food Sources:
Our study revealed that food expenditure generally takes up most of an average household's income. Given this, we should take steps to ensure that food sources are both affordable and abundant, support local agriculture and farming initiatives, and implement subsidies and price controls on essential food items to make them accessible to all socioeconomic groups.
Create Employment Opportunities:
Develop programs that provide more employment opportunities for the masses to increase their monthly income to enable them to afford and support their needs. Encourage innovation and entrepreneurship by offering grants, training, and support services.
Promote Renewable Resources:
Advocate for the conservation and utilization of renewable resources. This does not only potentially lower the monthly expenses on regular resources, but also decreases the consumption of environmentally unfriendly materials.
How this helps Filipinos
Budget Management:
Through the identified features that greatly affect a household's finances, Filipinos can make more informed decisions about where to cut costs or allocate their income.
Financial Planning:
Prioritize certain income types that greatly affect financial stability. This study could potentially aid Filipinos in choosing which avenues could greatly improve their financial statuses.
Risk Assessment:
The resulting logistic regression model can serve as an assessment tool for the risk of financial stability. Based on its results, one can take preemptive measures to identify problems concerning their finances.

Brill Riña
I'm a graduating 4th year Computer Science student with a strong passion for UI/UX and front-end development. I enjoy crafting narratives through visually appealing elements. I hope you enjoyed our work!
When I'm not coding, I'm probably painting as I also enjoy creating beautiful pictures using my self-learned skills. Otherwise, I also play video games for fun.

Jeff Pecson
I'm a graduating 4th year Computer Science student who has several experiences in website development and has recently been interested in data science.
You can find me playing video games or watching my favorite series when I'm not working. I also enjoy going to cafes that have good atmospheres!

Rafa Partosa
I am a Computer Science student who enjoys learning anything related to Computer Science but still forgets how to use GitHub sometimes.
Right now, I'm either coding in a dark airconditioned room blasting DnB or chasing a frisbee in a field somewhere getting sunburned. I also like to go running at 4am.

